Aprende en Comunidad
Avalados por :


¡Acceso SAP S/4HANA desde $100!
Acceso a SAPIntegrating Highcharts into Your SAPUI5 Application: A Comprehensive Guide
- Creado 01/03/2024
- Modificado 01/03/2024
- 25 Vistas
0
Cargando...
Hello again community, and welcome back to my third blog on the series of different chart libraries I have incorporated into a #sapui5 application.
1) My first blog was on ChartJS .
2) The second blog about the Viz charts library that is native to sapui5.
On this blog, I am going to showcase how to integrate Highcharts chart into a sapui5 application. One interesting thing about #Highcharts I was not aware of and mbensan mentioned to me is that they are a part of the SAP Analytics cloud, so I hope this blog is helpful for developers on both areas.
on my next blog - i will show you some of the common Highchart events - read it here

First and most importantly, I want to mention that I used a free evalutation license for Highcharts. There are some other licenses that have a cost associated depending on the number of developers, etc. . I am not going to go into detail of the license since I used one for evaluation purposes only.
** make sure you look up the various license scenarios and decide if one of them is fit for your orgnaization **
Secondly , I would like to thank Highcharts for the awesome documentation they have. By far, they showcased the most accurate and complete documentation , as well as their API showing the object hierarchy.
I am really impressed at the ways it was explained and how it shows a lot of the details like this one:

Documentation like the one above simplifies the life of the developer and further speeds up the developing cycle due to that developers do not need to spend hours and hours trying to see what are the available properties for specific controls. (I mentioned this as one of the negative experiences I had on the lack of documentation from the viz charts under the Samples section)
Additional features for the Highcharts include the 3D charts - these look really awesome! check them out!
Other types of charts are also available: Polar Charts, spiderweb chart, vector plot, pyramid, ... and the list goes on and on. There are a lot of really good examples, please check the demo section of this site.
The steps to make this happen are the following:
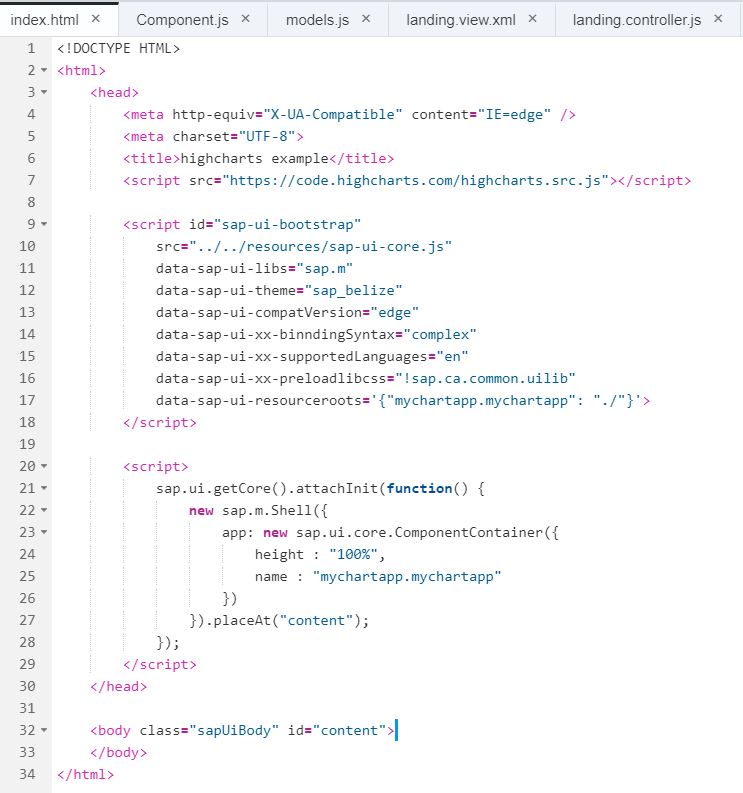
1) I used a reference to a CDN (content delivery network) to get the highcharts library ... make sure you read the license agreements as this is not a free license.*

2) add a div that will contain your chart into your view. * You can also programatically add charts into your application in case you need to add these charts dynamically.

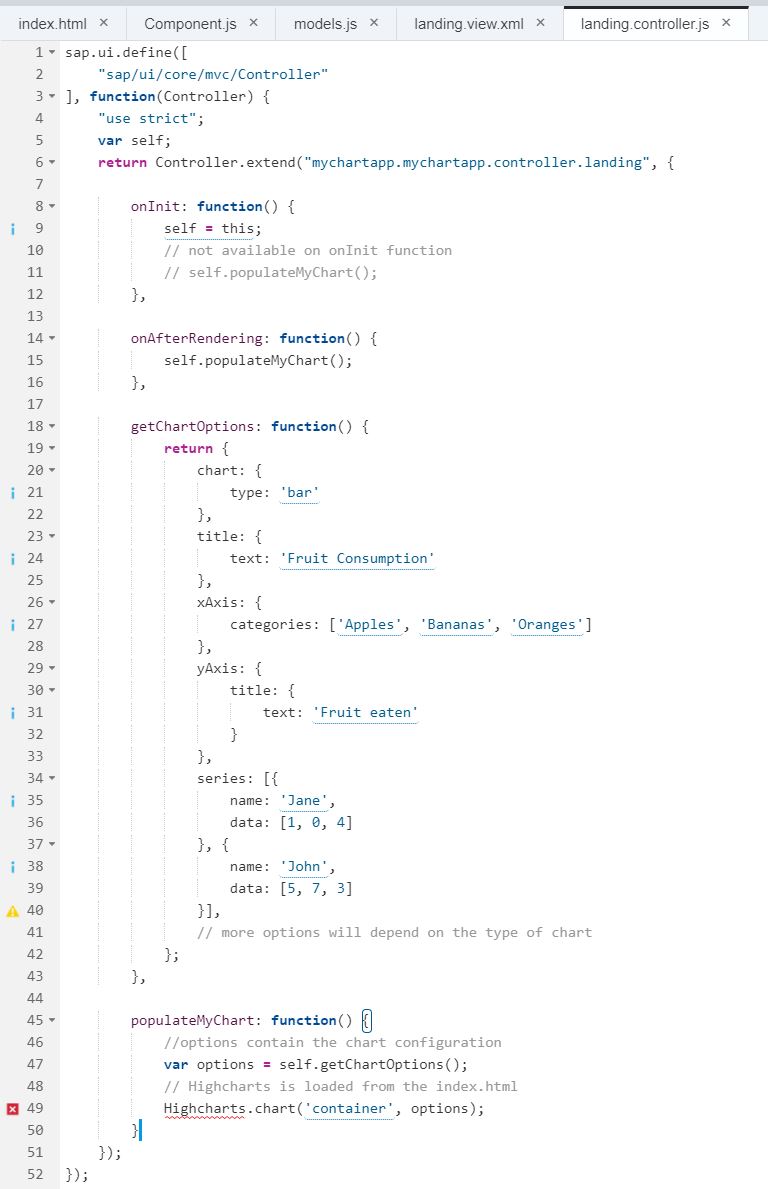
3) in your controller, set up the configuration for your HighChart. Notice the easiness of how to set up the HighChart object..
HighChart('<ID_OF_DIV>', options);
** options - is the object you need to set up that contains the configuration of your chart, such as: chart type, title, labels, axis, data (series), etc. Most charts have similar configuration, however, make sure to check out the available options for the chart you are trying to
use.

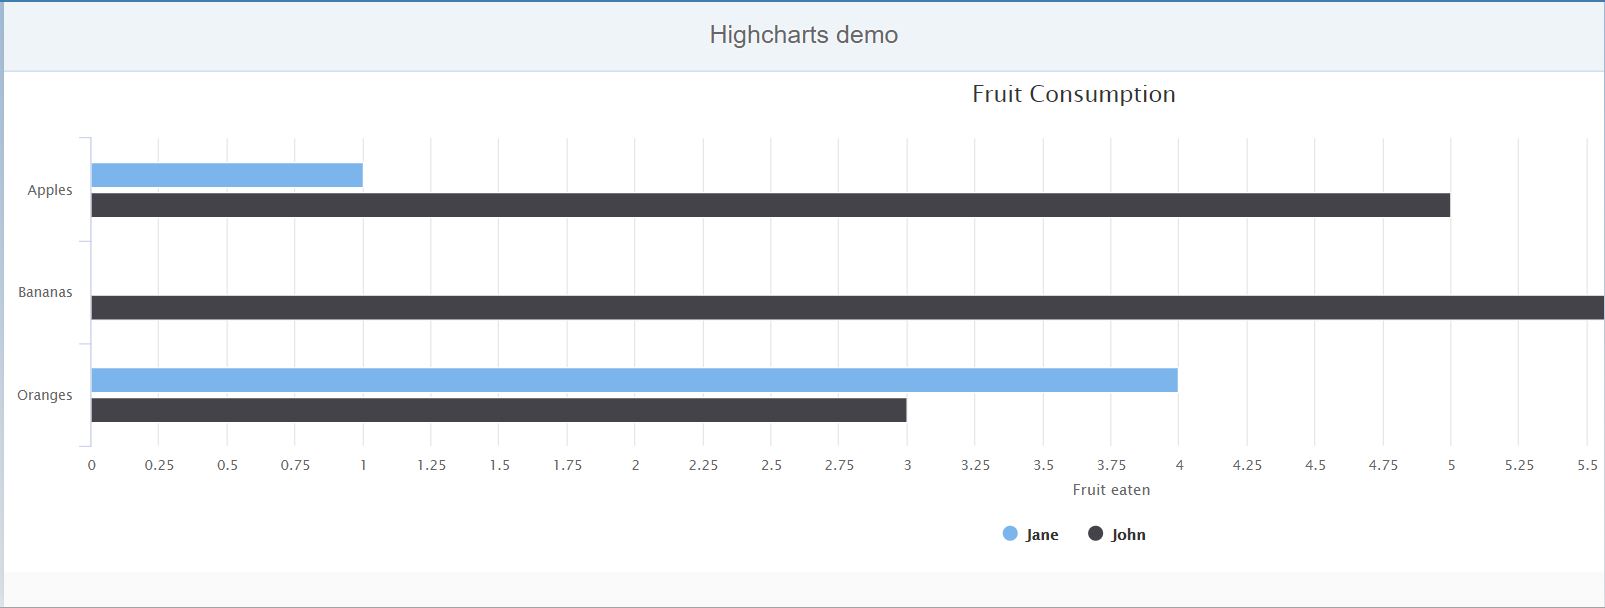
once you have your index, view, and controller set up, run your app and you will see your Highchart in action - this is what the demo HighChart looks for me on my ui5 app

Other great features you can use while using Highcharts is that you can capture event interaction such as mouse clicks for a drill down, etc. You may wonder what use cases this would have? well, in my case, I am using a chart to display aggregated data, then with the drill down, i can show detailed data either with another chart or even with a combination of a chart and a table. Such type of scenario is very common on analytic applications and it does not take much more effort to satisfy a requirement like this and really impress your end users.
Although short, I hope this blog has helped some of you to understand another available type of charting library out there. Please share the blog, and any comments you may have.
<
1) My first blog was on ChartJS .
2) The second blog about the Viz charts library that is native to sapui5.
On this blog, I am going to showcase how to integrate Highcharts chart into a sapui5 application. One interesting thing about #Highcharts I was not aware of and mbensan mentioned to me is that they are a part of the SAP Analytics cloud, so I hope this blog is helpful for developers on both areas.
on my next blog - i will show you some of the common Highchart events - read it here

First and most importantly, I want to mention that I used a free evalutation license for Highcharts. There are some other licenses that have a cost associated depending on the number of developers, etc. . I am not going to go into detail of the license since I used one for evaluation purposes only.
** make sure you look up the various license scenarios and decide if one of them is fit for your orgnaization **
Secondly , I would like to thank Highcharts for the awesome documentation they have. By far, they showcased the most accurate and complete documentation , as well as their API showing the object hierarchy.
I am really impressed at the ways it was explained and how it shows a lot of the details like this one:

Documentation like the one above simplifies the life of the developer and further speeds up the developing cycle due to that developers do not need to spend hours and hours trying to see what are the available properties for specific controls. (I mentioned this as one of the negative experiences I had on the lack of documentation from the viz charts under the Samples section)
Additional features for the Highcharts include the 3D charts - these look really awesome! check them out!
Other types of charts are also available: Polar Charts, spiderweb chart, vector plot, pyramid, ... and the list goes on and on. There are a lot of really good examples, please check the demo section of this site.
The steps to make this happen are the following:
1) I used a reference to a CDN (content delivery network) to get the highcharts library ... make sure you read the license agreements as this is not a free license.*

2) add a div that will contain your chart into your view. * You can also programatically add charts into your application in case you need to add these charts dynamically.

3) in your controller, set up the configuration for your HighChart. Notice the easiness of how to set up the HighChart object..
HighChart('<ID_OF_DIV>', options);
** options - is the object you need to set up that contains the configuration of your chart, such as: chart type, title, labels, axis, data (series), etc. Most charts have similar configuration, however, make sure to check out the available options for the chart you are trying to
use.

once you have your index, view, and controller set up, run your app and you will see your Highchart in action - this is what the demo HighChart looks for me on my ui5 app

Other great features you can use while using Highcharts is that you can capture event interaction such as mouse clicks for a drill down, etc. You may wonder what use cases this would have? well, in my case, I am using a chart to display aggregated data, then with the drill down, i can show detailed data either with another chart or even with a combination of a chart and a table. Such type of scenario is very common on analytic applications and it does not take much more effort to satisfy a requirement like this and really impress your end users.
Although short, I hope this blog has helped some of you to understand another available type of charting library out there. Please share the blog, and any comments you may have.
<
Pedro Pascal
Se unió el 07/03/2018
Facebook
Twitter
Pinterest
Telegram
Linkedin
Whatsapp
Sin respuestas
 No hay respuestas para mostrar
Se el primero en responder
© 2025 Copyright. Todos los derechos reservados.
Desarrollado por Prime Institute
Hola ¿Puedo ayudarte?

