
Aprende en Comunidad
Avalados por :


¡Acceso SAP S/4HANA desde $100!
Acceso a SAPCómo configurar el entorno de desarrollo para depurar aplicaciones MDK con Visual Studio Code y Android Studio
- Creado 01/03/2024
- Modificado 01/03/2024
- 173 Vistas
0
Cargando...
Debugging code is one of the most useful tools in the developer's belt. If you are just getting into Mobile Development Kit (MDK) you might notice that there's not much coding at first and you just find yourself focusing on the business logic part of your project. But once you get into more complex scenarios, you'll most definitely need to write your own JavaScript rules. MDK's extension for Visual Studio Code allows us to set breakpoints in our code and debug it during runtime, as well as make use of a variety of very useful console log features. In this guide, I will show you how to achieve this.
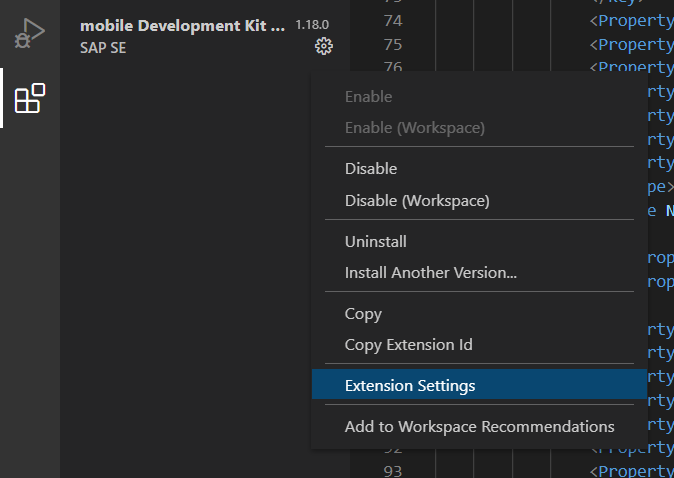 In the extension settings you need to populate the
'Mdk: Debug App Root'
field with the folder path that contains your app's client:
 And then the
'Mdk: Mobileservice'
field with the following key-value items:
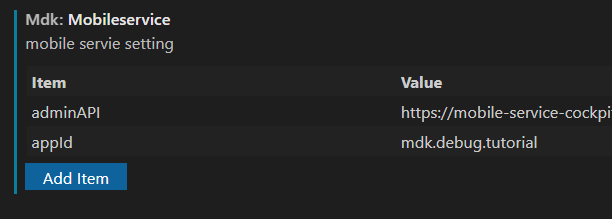 You can find the value for your
adminAPI
by logging into your Mobile Services cockpit, clicking on
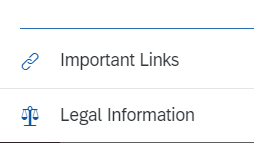
'Important Links'
in the bottom left of your welcome screen, and then clicking on
'Copy Admin API':
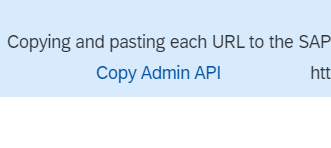 Now go to your Visual Studio Code workspace and bundle your app by clicking on
'Terminal' -> 'Run Build Task' -> 'MDK: bundle build'
.
 This will generate a brand new
'launch.json
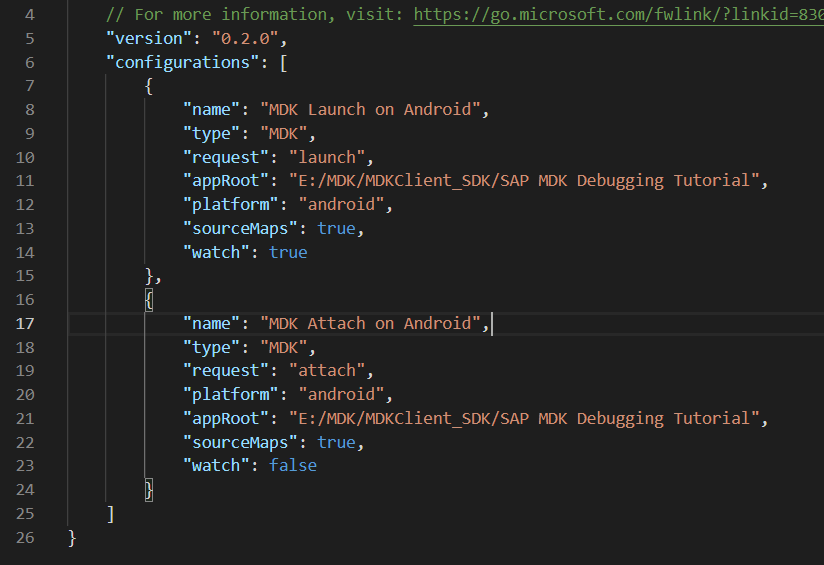
' file where you'll once again populate the 'appRoot' property with the folder path to your app's client build:
 Now perform a fresh deploy
from Visual Studio Code
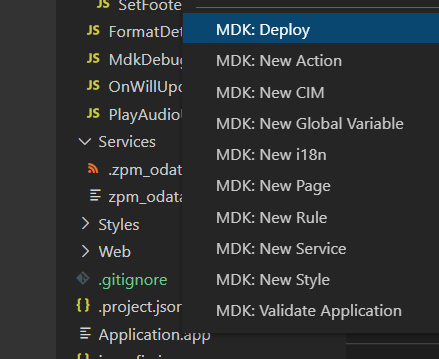
to update your project's source map, you can achieve this by right-clicking your Application.app file and selecting '
MDK: Deploy'
:
3) Run a virtual device in Android Studio
We will use Android Studio's Virtual Device Manager to emulate an Android Device which will be attached to Visual Studio Code to run and debug our MDK apps.
![]()

Prerequisites
• Have an MDK app ready to be deployed and debugged. If you still don't know how to do this, let me point you in the direction of this great tutorial: Get Started with the Mobile Development Kit. • Have Visual Studio Code installed and Visual Studio Code's MDK extension as well (you can easily find it by searching for it in VSC's extension marketplace). • Export your app's project from your IDE and then import it into a Visual Studio Code workplace. The recommended way to do this is by using a GitHub repository. If you don't know how to do this with the Business Application Studio IDE, this guide might come in handy: How to setup GIT in SAP Business Application Studio • Have Android Studio installed (If you followed the tutorial from the previous step you should already have it)1) Build your own MDK client using MDK SDK.
Have the latest version of Mobile Development Kit SDK installed and build your app's client with it. This topic is already explained in this tutorial: Build Your Mobile Development Kit Using MDK SDK . The author of the tutorial did a great job explaining how to do that so, to avoid redundancy, I won't get into much detail about it.2) Configure your Visual Studio Code workplace and MDK extension.
Now in Visual Studio Code we have a few configuration steps left before we are able to start running and debugging our app. First click on VSC's 'Extensions' tab, look for the Mobile Development Kit extension and click on its gear icon, then select the 'Extension Settings' option: In the extension settings you need to populate the
'Mdk: Debug App Root'
field with the folder path that contains your app's client:
 And then the
'Mdk: Mobileservice'
field with the following key-value items:
 You can find the value for your
adminAPI
by logging into your Mobile Services cockpit, clicking on
'Important Links'
in the bottom left of your welcome screen, and then clicking on
'Copy Admin API':

 Now go to your Visual Studio Code workspace and bundle your app by clicking on
'Terminal' -> 'Run Build Task' -> 'MDK: bundle build'
.
 This will generate a brand new
'launch.json
' file where you'll once again populate the 'appRoot' property with the folder path to your app's client build:
 Now perform a fresh deploy
from Visual Studio Code
to update your project's source map, you can achieve this by right-clicking your Application.app file and selecting '
MDK: Deploy'
:

3) Run a virtual device in Android Studio
We will use Android Studio's Virtual Device Manager to emulate an Android Device which will be attached to Visual Studio Code to run and debug our MDK apps.
Pedro Pascal
Se unió el 07/03/2018
Facebook
Twitter
Pinterest
Telegram
Linkedin
Whatsapp
Sin respuestas
 No hay respuestas para mostrar
Se el primero en responder
© 2026 Copyright. Todos los derechos reservados.
Desarrollado por Prime Institute
Hola ¿Puedo ayudarte?


